About
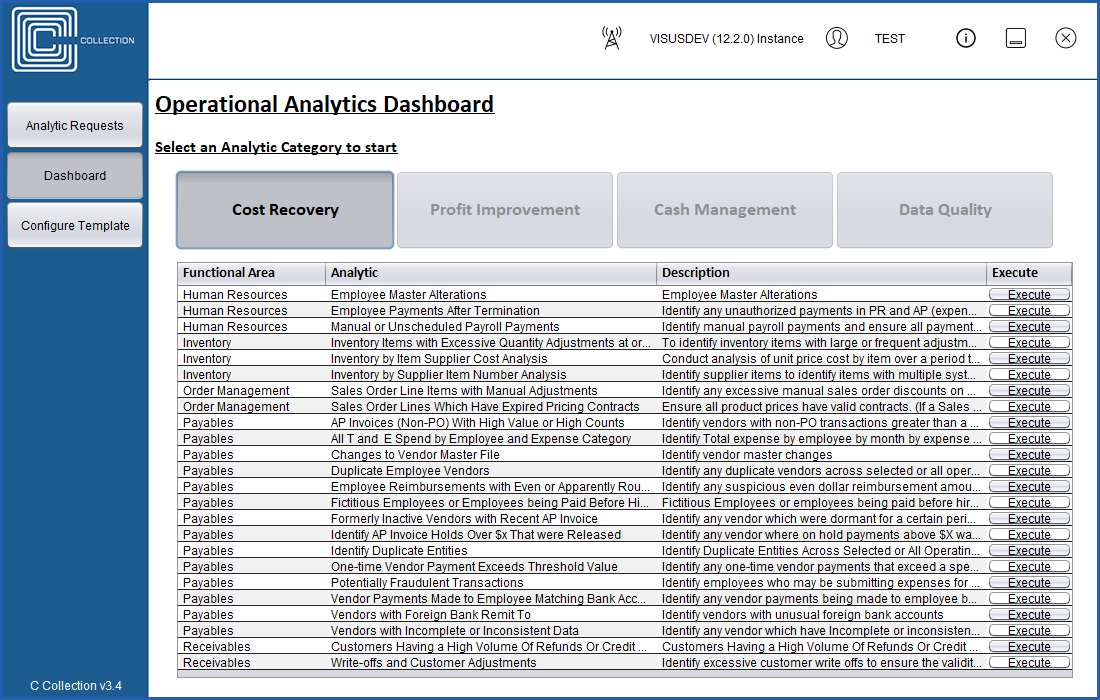
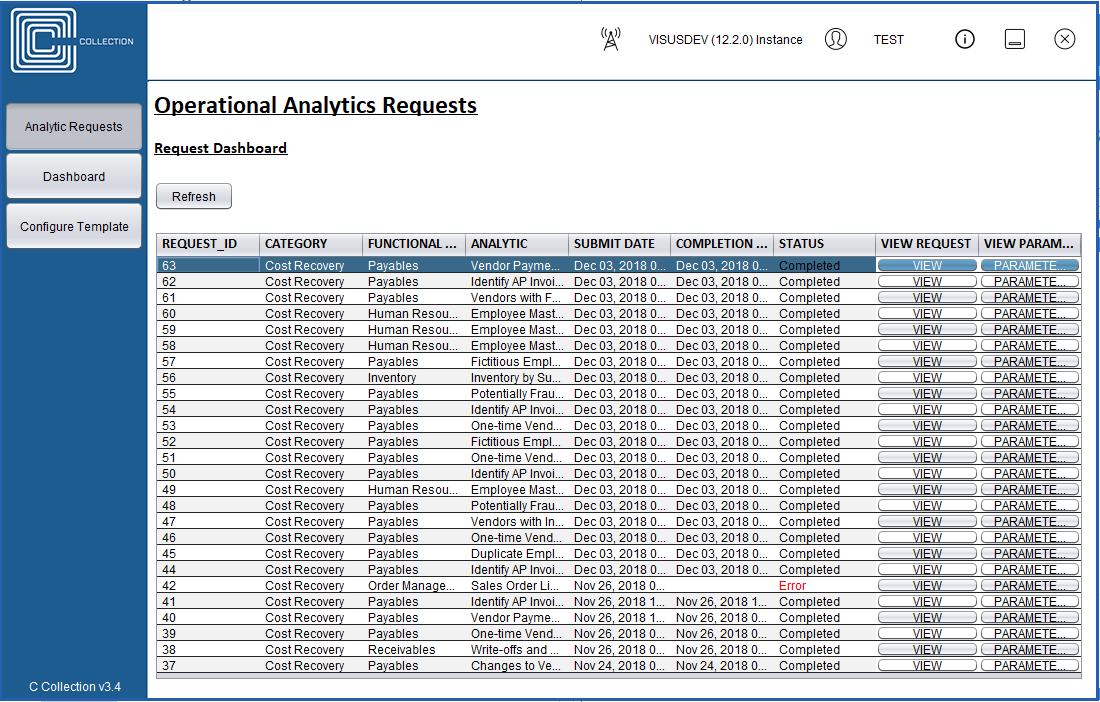
The Cost Recovery analytics bundle focuses on eliminating duplication, identifying unusual
costs,
irregular or potential fraudulent activity, unauthorized purchases, overpayments, inactive
accounts and contracts, and missed opportunities for savings. Cost recovery analytics
works behind the scenes, allowing you to monitor expenditures, prescribe solutions
early on, and predict potential overruns by automatically reviewing massive
amounts of data. Potential errors are identified based on details within
your payables, inventory, and receivables, combined with well-tested
analytic techniques that uncover payment discrepancies.
Cost Recovery analytics will identify duplicate payments across operating groups, or the
same expenses submitted by two or more employees, a vendor match inventory, among
others. The Cost Recovery analytics can help you uncover and potentially
recover money that could have been lost. The insights gained could have
a big impact on how you manage vendors, improve supply chain
visibility, standardize invoicing, reduce regulatory risk,
and more.
Example Scenarios
The Cost Recovery Bundle will include analytics to:
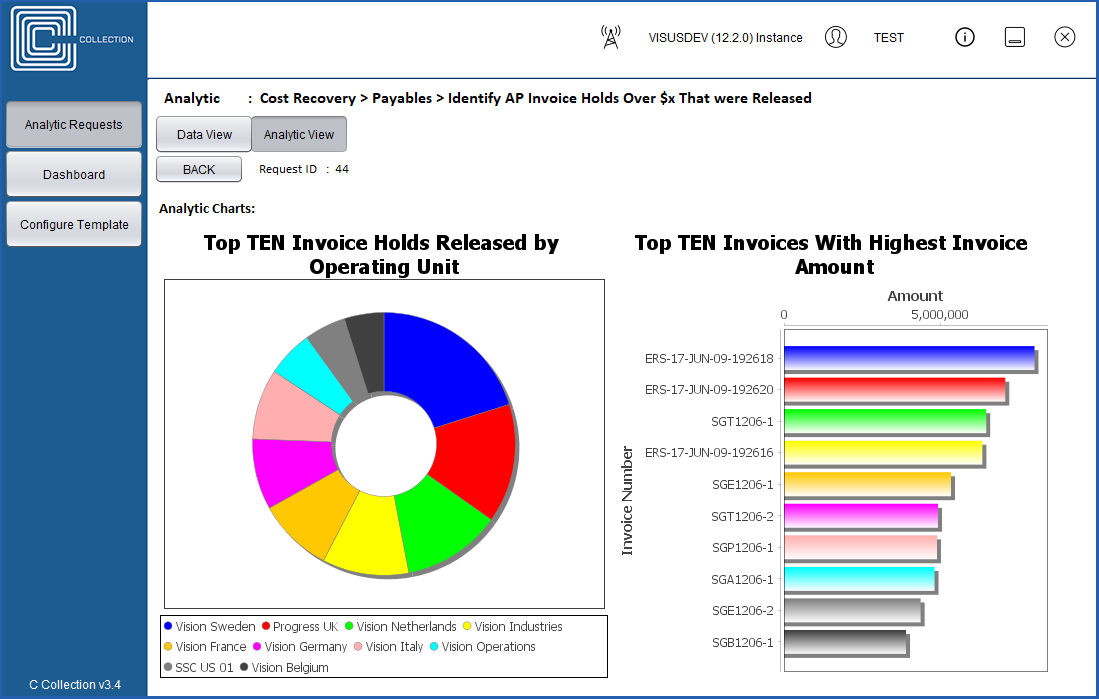
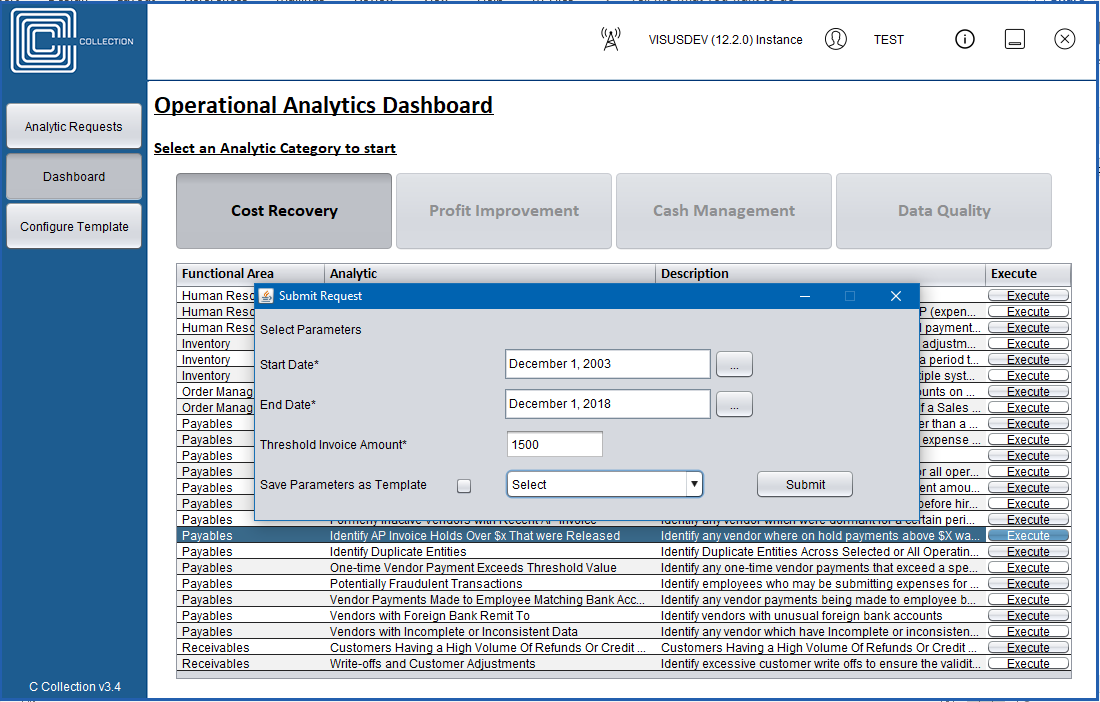
Identify Duplicate Invoice Payments: Compare data across OUs and business units to identify
situations
that may indicate that duplicate payments have inadvertently been made.
Vendor-Employee Match or Duplication: Analyze indicators that there may be duplicate vendors,
or identify vendors who are also employees.
Inventory by Supplier Item Number: Analysis of the supply chain as it relates to matching
identifying products that may be purchased under different item numbers – purchasing the same
or
similar items
under different product numbers or perhaps by different operating units.
And more!
Features & Benefits

Ease of access for critical analytics

Robust content

Tight Intigration with EBS source data

Ability to analyze the entire organization, across business groups,
across operating units, across inventory organizations

Analysis may be done as often as necessary - weekly, monthly, quarterly, etc.

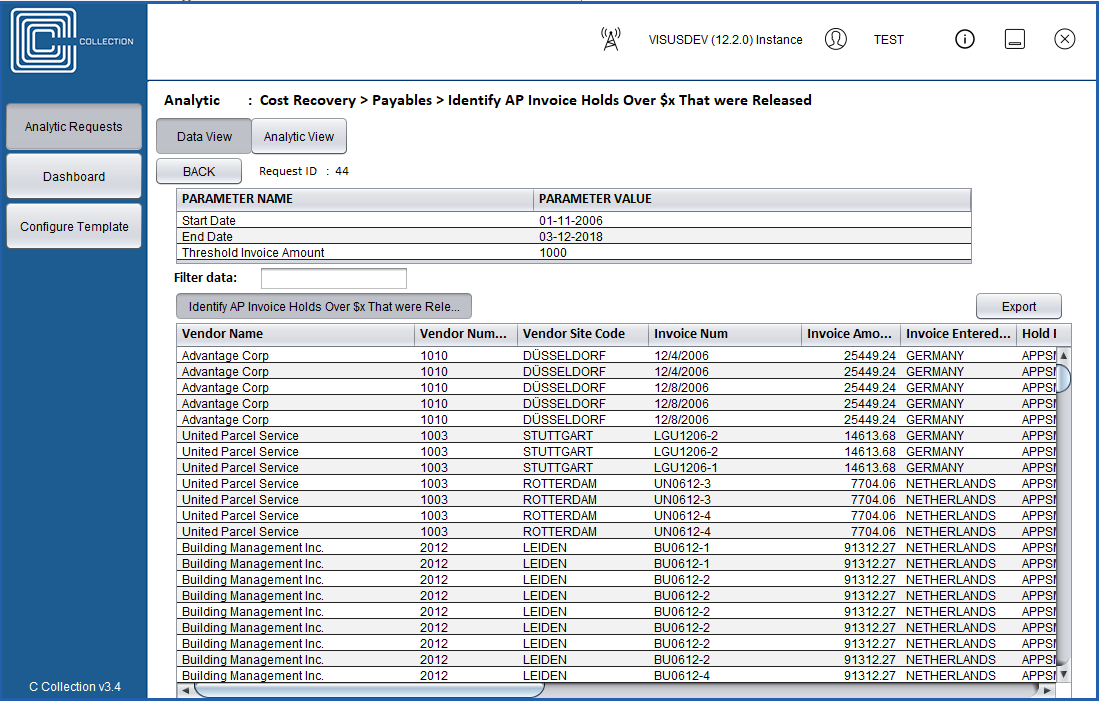
Full drill down to transaction-level detail

Complex analysis with knowledge of all data relationships

Identification of red flags and potential systemic issues

Out-of-the box software

Web-based architecture allows cloud installation

Finds data across multiple modules and thousands of tables and build that intelligence
into a software product


